Tuesday, 3 December 2013

Report on the outcomes of a consultation looking at visual intervention with a student identified as being Dyspraxic and dyslexic.

 Report on the outcomes of a consultation looking at visual intervention with a student identified as being Dyspraxic and dyslexic.


This particular post is I believe of considerable importance; it is a detailed analysis / deconstruction of the response of one individual to changes in the presentation of text on a computer screen. This could have been any adult but the graphs would have different peaks. About half of the students show a negative response to red reduction rather than a positive response.  Other posts will supply more general background to the ideas. The comments on visual span are highly relevant to the emerging research that was reported at the Oxford event.

The student was referred as part of her Disabled Student’s allowance.

The student was diagnosed as Dyslexic/Dyspraxic.

The consultation was to ascertain visually associated intervention to ameliorate her difficulties with text.

Content
  1. Background
  2.  Focussing issues, Optical correction
  3.  Font size, image size, reading distance orthoptic/convergence issues.
  4. Reading speed and stamina
  5. Crowding.
  6. Visual span
  7. Screen  luminosity and colour, 
  8. Memory issues
  9. Summary of interventions
  10. Comparisons of eye movements  in default and optimal conditions.


Background information.

The student  was first diagnosed with ophthalmic problems at the age of 7 years.  Since then there has been a progressive change in her prescription which is to be expected.

She has correction for myopia (short sight) and for astigmatisms in both eyes. The correction for her left eye is greater than for her right eye.

She has been told that her left eye is suppressed (there is difficulty processing visual information with data from her left eye. If she covers her right eye the image is less clear than if she covers her left eye.

When reading for extended periods she often…
  1. Covers her left eye
  2. Turns her head sideways (turning towards the right).
  3. If using a computer, increases the size of the text using the ‘zoom’ facilities on the computer.
  4. Becomes very tired giving her very short work periods and needing longer and longer rest/recovery times. These work periods are only a few minutes.
  5. Becomes increasingly, easily distracted.
  6. Experiences upper body and neck discomfort.

The consultation concentrated on identifying these issues quantitatively and identifying strategies to reduce/remove these barriers to studying.

Outcomes of the Consultation.
Focussing issues, Optical correction
         Using her glasses, which she uses continuously, the correction for her right              eye appears to leave distance vision still too difficult.

This implies that the correction is too weak for distance vision. A bifocal correction might be a solution.

The astigmatism correction appears to be correct for both eyes.

The vision from her left eye is still compromised at far and near as would be expected with monocular visual suppression.

This asymmetry in visual performance would give rise to distance judging problems at far and near. This would give ‘clumsiness’ characteristics at far and near which would mimic dyspraxia.

There is visual data being collected by the left eye which would assist in distance judging but ‘at near’, when reading or writing. 

There is evidence from the eyetracking data that the  left eye data is further suppressed leading to increased suppression of the left eye and increased and fluctuating fixation disparity between the two eyes.  This is reduced by the head turning but not prevented.

The head turning  would also give rise to upper body and neck discomfort as small movements would occur as a reflex in trying to overcome the diplopia.

She experiences diplopia (double vision effects) when reading or viewing near objects. The diplopia is greater if the object is nearer. The further away the object is the less the diplopia.

Using the larger fonts the distance from the text increases, reduces this effect.

(Diplopia occurs when the two eyes are focussed (fixated) at points too far apart (fixation disparity) so that the visual system is unable to compute a single perception (image). In all people there is some disparity  and this is part of efficient vision. But if it is too great then the visual system is incapable of the computation of a single image.  This is referred to as ‘insufficent fusional reserves.. and is associated with the idea of ‘convergence insufficiency’.

If the system can intermittently ‘fuse the data’ or the disparity keeps varying and data from one eye is not continually suppressed then the person gets a perception of unstable or wobbling text or the whole visual scene appears to wobble… Oscillopsia. To reduce this effect some people keep ‘wobbling their heads subconsciously which can give rise to nausea and neck/upper body/back aches.

****************************************************

Reading speed


Changing the font size affects her reading speed as shown in the graph below. This will be in response to a combination of the following effects.
  1. Changing reading distance.
  2. Changing  crowding effects(ability of the system to compute the edges of the letters)
  3.  
  4. Changing the distance for the eyes to travel between words./ changing the demand on the eye muscles.


The first two of these will affect the number of letters which she can ‘see’( perceive) in each fixation, her visual span. Recent research has shown this to the controlling factor in reading speed for many people.


( please remember the reading speed is a measure of phonological output as a response to changing visual input)


Using the bigger font size increases the image size on her retina, this would reduce crowding effects and allow the processing of more letters at once (parallel processing). Too big a letter size will move the target fpor the next saccade too far into the peripheral retina ( away from the fovea) reducing the accuracy of the saccade, slowing the reading down.

On default (font 12) the visual span is averaging 1.60 letters. A person with no difficulties will be processing 10+ letters per fixation
When using her optimal conditions.   There were initially 3.3 characters per fixation .  This is more than a 100% improvement.
In the last line, however, the number of fixations was 14 for 79 characters That is 5.6 letters per fixation.

 There is a continual gain in the size of the visual span as she reads with optimal conditions and this is reflected in the improving reading rate the more she reads, as in the graph below taken from the eyetracking data.


We can compare this to changing reading rate when reading in default conditions in the graph below..


Combining the two graphs makes the difference in reading performance very clear.


These reading performance graphs reflect the changing visual span as the reading period changes.  Visual span can be considered as controlling reading performance rather than controlled by reading performance. As the visual system gets ‘stressed’ the visual span decreases to the point where the process becomes to difficult to make use of the process. This is likely to be a component of her reading stamina problem.

Memory issues

If a person has a short visual span, then the number of bits of visual data needed to ‘read’ a sentence will be much greater than for someone with the ‘normal visual span’ .To read and comprehend a sentence would make a much greater demand for working memory  from the ‘central executive’( Alan Baddeley’s model) leaving reduced resources  for comparison of the concepts intrinsic in the sentence with the concepts in long term memory. Other /additional memory strategies would be needed. Study time would need to be greater.
By increasing the visual span, memory difficulties, when reading should be ameliorated.

The decreasing reading speed in default reading conditions and associated limited reading stamina consequence, would further limit her total read/study time.

Reading speed, screen pixel luminosity


Overall screen brightness.


There is a relationship for The student  between overall screen brightness and reading performance.  This can be seen in the graph above.
The total amount of light entering her eyes is controlled by her pupil dilation. This reflex is designed to optimise the rate at which the photons are captured by the pigment molecules in the cone cells of her retinas; but it is controlled by ambient lighting intensity. There may be a difference between the optimal intensity landing on her fovea ( centre of focus of the images on the retina) and the peripheral retina. We do not know. In her case when font size has been optimised this is now limiting her reading performance.
158/255 is the brightness used for the rest of the testing..


Changing the green pixel brightness

As the green pixels are dimmed then the rate at which the green pigment in the green cone cells gets bleached is reduced.  This will lead to a change in nerve impulse generation. Possibly to an increase in crowding effects and reduced visual span for The student .


Changing the red pixel brightness


This is completely different to the effect of changing the green component. Although in a way we are really still changing the ratio of red : green stimulation.This ratio is the basis of the colour vision /colour recognition process which must ultimately be based on changing the impulses per second delivering information to the visual cortex and hence the mediator in object edge detection..visual processing.


This graph shows clearly the mathematical relationship between the ratio of green to red pixel brightness and the reading performance of The student .
 
All the red:green optimisation to this point has been undertaken with the blue value set at 158 as determined by the initial screen brightness study.

Changing the blue pixel brightness.


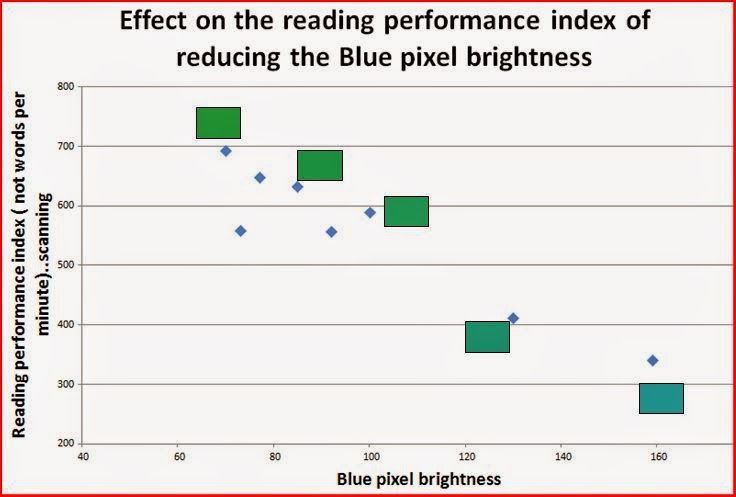
The cone cells containing the blue sensitive pigment are not found in the centre of the fovea.  There is a response to changing the blue pixel brightness but often very little and there appears to be a change with use of the background on screen for reading.

 There is good research evidence that the amount of blue light affects the magnocellular system particularly ( see research by John Stein al.). The red/green ratio is likely to be more associated with the ‘parvocellular system’, the edge detection system; the system which collects the data to identify the ‘object being looked at’/receiving attention.

The graph below shows the effect on one aspect of reading performance (scanning).  However, in terms of visual clarity when using an overlay or reading The student , preferred not to have the blue reduced. As such a cyan overlay closely mimicking the optimal red green ratio was provided for her to use with printed material.  Looking at the graph about reducing the red, it must be remembered that if the cyan filter removed too much red then this ‘same colour’ would  start to limit her reading performance, similarly if the cyan did not remove enough red then there would only be a partial benefit to her.  The computer screen setting will provide the optimal red/ green.
On her computer screen she has the option of using a low blue   ( green looking!) screen or the optimal red:green screen ( grey/Cyan).
In two months time a second consultation will determine changes in her visual system’s need and then precisely coloured prescription glasses mimicking her optimal screen settings can  be provided as an alternative to overlays or screen colour management.


Summary
The student  needs the following interventions to optimise /maximise her reading performance.

  1.  Printed material where possible printed at font 21.
  2. Where possible all documents to be provided electronically to enable optimal reading conditions.
  3. To be able to make use of her cyan overlay whenever appropriate.
  4. In lectures meetings, to be able to sit to the  left of the main centre of visual attention to minimise distractibility.
  5. At the next consultation the possible provision of optimally tinted prescription glasses .


Comparison of eye movements using default conditions and optimal conditions.

With default conditions the distance between the two graphs keeps changing. Whereas with the optimal conditions it stays more consistent.
If we look at the more detailed graphs, shorter time periods the difference between the two conditions is clearer.


Graph showing the detail of saccades and fixations by both eyes using optimal conditions for a 2 second period for comparison with a 2 second period using default conditions.

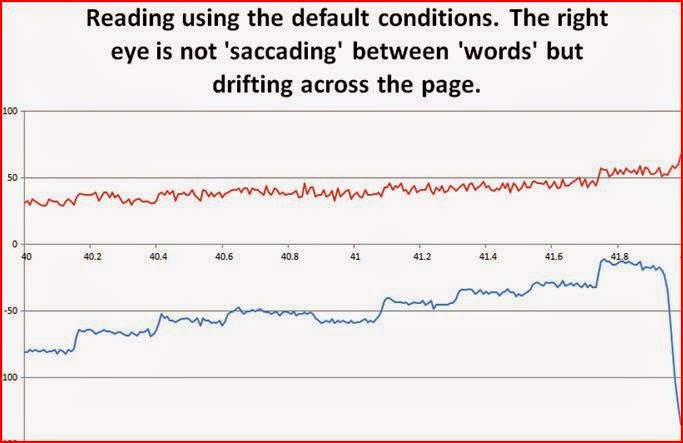


The graph shows that both eyes are in general working together.  If this is compared with the eye movements when reading on default it is easily seen that the left eye is hardly saccading.


Thursday, 28 November 2013

Comments on an article from Harvard about e-readers and dyslexia. A visual component acknowledged in the USA!


I have been thinking a great deal about the ‘research’ that has come out of Harvard recently.
The abstract I reprint below.  This research has been published on PLOS ONE, a peer reviewed, open access journal.  http://www.plosone.org/article/info%3Adoi%2F10.1371%2Fjournal.pone.0075634.
The original, article makes very interesting reading especially in the context of the USA  where to even imply the possibility of a visual component in dyslexia can bring down the ‘wrath of the IDA’ !
After re-reading the original article, which I commend everyone to read, the conclusions seem a bit guarded. I have highlighted components of the abstract which I feel need much more consideration.
E-readers are fast rivalling print as a dominant method for reading. Because they offer accessibility options that are impossible in print, they are potentially beneficial for those with impairments, such as dyslexia. Yet, little is known about how the use of these devices influences reading in those who struggle. Here, we observe reading comprehension and speed in 103 high school students with dyslexia. Reading on paper was compared with reading on a small handheld e-reader device, formatted to display few words per line. We found that use of the device significantly improved speed and comprehension, when compared with traditional presentations on paper for specific subsets of these individuals: Those who struggled most with phoneme decoding or efficient sight word reading read more rapidly using the device, and those with limited VA Spans gained in comprehension. Prior eye tracking studies demonstrated that short lines facilitate reading in dyslexia, suggesting that it is the use of short lines (and not the device per se) that leads to the observed benefits. We propose that these findings may be understood as a consequence of visual attention deficits, in some with dyslexia, that make it difficult to allocate attention to uncrowded text near fixation, as the gaze advances during reading. Short lines ameliorate this by guiding attention to the uncrowded span.

In the actual paper, they state that they were comparing reading performance on a font 14 in the print with font 42 on the e reader.

In the actual paper, they state that they were comparing reading performance on a font 14  in the print with font 42 on the e reader.


Now don’t get me wrong, but perhaps they should have looked at other font sizes on paper?  They did say that the e reader allows accessibility options so really they were not really looking at e readers, but at font size. If you read other postings in this blog, this would not surprise you at all.  The graph on optimal font size for an individual shows the critical importance of font size.


Each individual appears to have an optimal font size. For most students in the UK which myself or my colleagues have seen it is far greater than font 14, the default used on the printed task.


The ‘pretty ‘graph above shows how the optimal font size varies in a population of dyslexic students.  The modal size is font 17. About half the students need a font greater than this. Very few though benefit from a size greater than 24.  This data is collected from students who have full optometric correction. The range of font optimal font sizes will reflect issues such as...
  1. Crowding effects associated with cone cell size.
  2. Diffraction issues associated with corneal problems
  3. Other low vision issues not correctible by optometrists.


In other postings there are graphs showing the effects on reading performance of
  1. Changing the background brightness to the text for individuals
  2. Changing the relative brightness of the red, green and blue pixels.

These effects will be affected by the individual’s working cone pigment densities, how quickly the epithelial cells they are plugged into can re-activate the pigment molecules after they are bleached, as they read as well as the ability of the individual’s iris to dilate and constrict to optimise the rate at which the pigments in general are being bleached.  I could even ‘hypothesize’ that changing the relative stimulation of the red and green cells, which is the basis of foveal edge detection, will change the rate of data transfer about those edges to the visual cortex.  I challenge anyone to explain it differently!
As such for each individual there would be a specific ratio which sends the most data per millisecond and this would provide the best provision of data for phonological processing, and ‘gaze’ management.


But I am not a Harvard researcher. So I will have to wait until they catch up.

Tuesday, 12 November 2013

Eye movements for a student with nystagmus reading compared with a fluent reader.


It has been said that Nystagmus is one of the most common forms of visual disability experienced by Schoolchildren. The same would then of course be true of all age groups, since it does not ‘ go away’.

What I have done in this blog is to try to explain and demonstrate how a ‘nystagmus’ actually affects the biology of reading. I have been privileged in my work with undergraduates in the UK; working with and assisting many adults who despite their nystagmus have made it into Higher education. With each one I have had the opportunity to work with them for several hours in my work with OmniRead and before that TintaVision.

I have been able to work with them to reduce the barriers to studying which their disability creates.

All this work is done objectively, using a binocular eyetracker which allows me to compare the actual dynamics of their eye movements as they read to those students with no reading difficulties.

Together we then calculate the conditions which will maximise their reading performance, by careful  adjustment of the parameters  which control the visual system’s ability to collect and transmit visual data as they read.  All the optimisation work is done using the controlled reading environment of a computer screen using the protocols and software developed by OmniRead and before by TintaVision.

Each person needs their own specific conditions to read the most effectively.  When they use these conditions then the way their eyes collect visual data mimics much more closely the way the most fluent readers do so.

Enjoy this posting . Please post comments or ask any questions that will help you further . There are other postings in the blog which put this work into context.
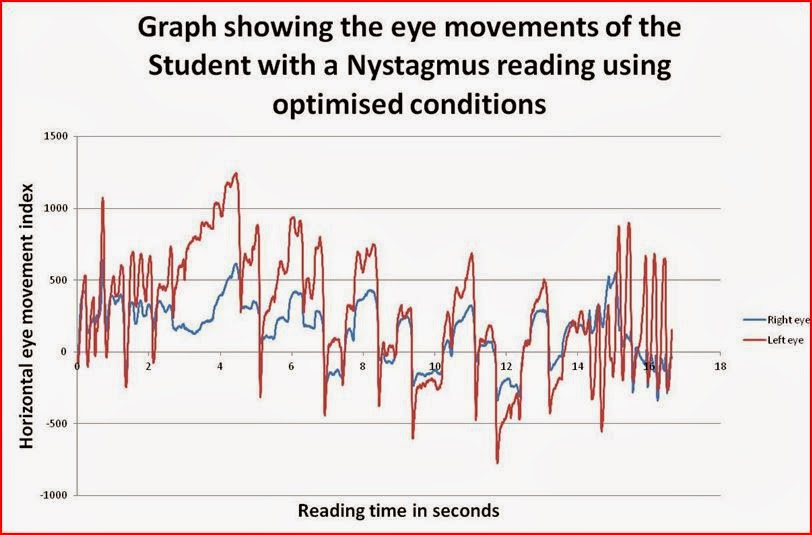
The graph below shows the eye movements of a Higher education student in the UK reading from a computer screen. This is for a period of 14 seconds.
The data was collected using an infra red eye tracker measuring horizontal eye movement at 300Hz. 


Summary
A student with a nystagmus ….

1. Collects and transmits a very small amount of visual data per second compared with a fluent reader.

 2. Almost certainly need to use more computational resources making greater demands on their central executive for visual processing than a fluent reader.


3. Collects reducing amounts of visual data per second as the reading time extends.There is a serious stamina problem.

4. Using optimised reading conditions increases the amount of visual data collected and transmitted per second and can improve the quality of the data, thereby probably reducing the demand for resources from the central executive with the major benefits ensuing from this.

5. A person with a nystagmus has difficulty maintaining a fixation.

A fixation is when the eye stops to collect the visual data allowing edge detection. The computation of the data into lines /edges can be converted into visual images matched against visual images retained in long term memory and enable reading.  This is not really ‘ like photography’ as taught in schools but  more like the way the digital data  from a roadside camera can be used to identify a car number plate. Or the way data is used in object recognition in airport baggage security systems.

The best way of seeing  what is going on is to compare the eye movement of a person with a nystagmus with the eye movement of a fluent reader using a binocular eyetracker.


The graph above shows the eye movements of a typical fluent reader. If we look at the graph as sets of stairs, the flat parts of the steps are when the eyes effectively stop moving for a while ,the fixations, to collect visual data to do the actual ‘reading’. The vertical lines are when the eye moves extremely quickly to position the eyes to take the next picture.  These fast movements are called saccades.

The longer vertical lines are the saccades back to the beginning of the next line of text.

There are 9 to 10  fixations during this 2 seconds. I have marked the fixations in green.
  
During this 2 seconds of reading, the system is not collecting and transmitting visual data for around 10 milliseconds per fixation, during the rapid movements.  

That  is  for around 100 milliseconds  5% of the time.
 
This pattern of eye movement is really a modified ‘nystagmus’. 

The nystagmus eye movement pattern  can be considered as a ‘primitive eye  visual search mechanism from before a mechanism developed to allow more extended time to collect and analyse visual data in a more detailed way.  This is partly possible by the development of the types of muscle fibres found in the muscles which control the eye movement. I need to write a posting on that !

Let’s now look again at what happens when a person, with a nystagmus is reading. Look at the graphs below.


What you can see is the eyes moving from left to  right ( the wobbly lines moving gradually up the graph) and after 10 seconds a sudden move back to the left of the page.

The left  eye appears to be continually ‘wobbling’. The right  eye sometimes wobbles, sometimes it does not.  After 11 seconds both eyes start to wobble with a much greater amplitude.

During the 10th second the left eye looks like it is reading moving along the line while the right eye wobbles.  There are 5 wobbles during this 10th second.  What is important is that the reading pattern by the system does ‘change’ over time; sometimes the ‘wobble’ is more obvious, sometimes not.


The duration of the ‘slow stages ( data collection and transmission times) is not consistent. Sometimes the left eye and sometimes the right eye appears to be collecting /sending the most data.

The graph below shows the eye movements after 3 seconds of reading. During these two seconds the right eye ‘wobbles’ 7 times. The left eye appears to wobble about 5 times while the right eye appears to go through an extended fixation.


If we compare this to what happens after 11 seconds when the system goes into a more obvious ‘wobble’/nystagmus; in this 2 seconds there are 6 ‘wobbles’.


Most people when reading take three or four pictures per second, so that is effectively the same as the number of ‘wobbles our  student was experiencing.

If we look at the amount of time being spent actually collecting and sending visual data to the ‘brain’, you can see quite clearly that the left and right eye are able to send different amounts of data and that the   two eyes although acting ‘sort of together’ are to some extent out of step, or phase, with each other.
In the first few seconds of reading by the student with the nystagmus….
the ‘green’ (data transmission) time is far less than the 95%  of time for the fluent reader

1. The fast movements are slower than for the fluent reader.

 2. The ‘slow’ stages are very unstable and actually hardly stop at all, so that the ‘computing of  steady images will be more demanding on the  central executive  leaving fewer resources to  make sense of the ideas in the text.

(Please note though that for even for a fluent reader, when you look really carefully at the eyes during fixations, the eyes do not actually stop. There have to be small movements continuously or they stop collecting and sending data; but these are very small movements.)

The graph of the reading after 11 seconds, shows that the ‘slow movement (visual data collection and transmission time) is becoming more restricted.  Increasing the demand on the visual processing system.


 Now consider what happens in terms of vision during the nystagmus eye movements.

There is no data transmission from retina to ‘the brain’ while the eyes are travelling rapidly,during the saccades.  The transmission only takes place during the moments when the eye is ‘stationary’( the fixations) OR during the slow phases of the nystagmus eye movement, as the eye changes direction.
In the graphs for the student with nystagmus above the slowest phases the eye effectively stops. Often it seems to ‘stall’ as if it is being ‘held back’ as if there is a feedback inhibiting the ‘fast movement’ or saccade.

There is a mechanism for ‘fixing’ but the feedback seems very weak and variable.

The following graphs were made using data when the student was reading using optimised conditions.


The first graph shows all the data collected by the binocular eyetracker with a period of about 2 seconds before they saw the text. This shows the ‘typical eye movement of a person with a nystagmus. There is then a period of around 12 seconds of reading ,when the eye movements are much more organised, starting to look much more like those of a fluent reader.  This reading period is followed by 3 seconds when the text has been removed from the computer screen. The eye movements revert to the typical nystagmus ‘style’.

Using the optimised conditions the visual data collection and transmission time ( green  sections) is a far greater proportion of the time.  There are now quite clear ( although still unstable) fixations.  The fast movement phases are ‘faster’ and a much smaller proportion of the reading time.

The student starts to enjoy reading.


…..


Wednesday, 6 November 2013

Reducing the barriers to computer use for a Dyspraxic student ( Not a dyslexic student)

Reducing the barriers for a Dyspraxic student

I recently worked with a Dyspraxic student looking at ways to reduce the difficulties/ barriers she experiences with text/reading/writing.

The student has been diagnosed as Dyspraxic, not dyslexic. 

There appears to be visual processing components to the barriers that……………… experiences.

By optimising the following aspects of the computer screen we were able to reduce/remove these barriers.


Font size……Increase needed.

Screen brightness/ ambient lighting…..Reduction in ambient lighting and screen brightness.

Screen background ‘colour’….. Precise, slight reduction in green pixel brightness compared with red and blue.


These I believe compound  the issue of her convergence ‘difficulties at near’;   that are associated with her very strong correction for near vision  which probably leads to her needing to be too close to the screen/ text when reading/writing, as if she is ‘short-sighted’. 

The intermittent alternate monocular visual suppression which is the visual system’s response to this would exacerbate her dyspraxia. There would be an associated clumsiness when reading or for 30 seconds to a minute after reading as ‘distance judging for fine motor activities would be compromised. More demand would be made for accurate Cerebellar calculations in terms of muscle tone management.


The viewing distance is possibly not actually a direct association with the long sight correction but in order to ensure that the image size on her retinas is an appropriate to maximise her ‘visual attention span’.  Raising the font would increase the this optimal viewing distance, reduce the convergence/fusion problems and hence give rise to  increased fluency, reduced demand on working memory and increased reading stamina.

It is also likely that the substantially reduced ambient lighting (from the wraparound shades) will increase the pupil diameter, contributing to and assisting the reduced background brightness which allows optimisation of the edge detection data process.

There was a slight but precise adjustment to the ‘colour of the background which further contributed to the barrier reduction.


Please note each of these comments is based on measured responses to changes in the viewing parameters.

Tuesday, 8 October 2013

No real change in the reading performance in Britain for the last 60years


No real change in the reading performance in Britain for the last 60 years.


Why should there be a change. There has been free universal access to education in Britain since 1944.  Changes in teaching method or style does really seem to have any effect.

All the ideas that have developed from the work I and others have been doing, supports the idea that your reading performance is a function of visual biology, need for glasses, retinal design/physiology,  font size, available working memory and the ‘nature of the language’.

These control
  • Your reading speed.
  • Your reading stamina.
  • Your ability to understand what you have read in the context of your previous reading..and hence your enjoyment.

These all combine to control your ‘total reading experience and hence your ‘literacy’.

Read the rest of the posts in my blog, going back over the last year.

Only if we change the way we present text can we get more people to higher levels of literacy
.
Ours is probably the most opaque language. Tough.


The USA has at least simplified some of the spellings!

Finland has the simplest language to read /write. That is why it is at the top.


Tuesday, 1 October 2013

IT is not the ‘COLOR’ background that controls the reading of many dyslexic and other people.

IT is not the ‘COLOR’ background that controls the reading of many dyslexic and other people.

In this blog I have tried to put down many of my experiences in helping dyslexic adults and people who find reading ‘hard work. I have also tried to put it in the context of the theories and hypotheses that abound in reading.

I have to some extent fallen into the trap of writing about my work using mental constructs /ideas/language that really get in the way of the explanations. 

I write of…… color background and reading,
                …… font size and reading

I write of……Reading speed
                ……Reading performance


I really want to write about the Biology of reading.

 On a computer screen, when we change the background screen settings; all we really do is change the rate at which red, green and blue absorbing pigment molecules are able to capture photons and release electrons.  These electrons ultimately give rise to a burst of ‘waves of depolarisations’ (nerve impulses)  which supply ‘digital’ data allowing ‘edge detection and the ability for our visual cortex to discriminate between edges in the visual scene, the edges/ lines and nodes which we call letters on the page.

 If the image stays static, the eye is not moving relative to the letters, then the data stops being sent.
 Since the eye is continually moving as it ‘takes its pictures,’ the digital data has to be detailed enough, accurate enough and coordinated with data on the ‘movement’ for the visual cortex to compute for us a clear image such that the reading speed we achieve is fast enough for us to enjoy, understand the ideas being conveyed by the word sequence.

Changing the relative stimulation of the red and green cone cells, by changing the red and green component of the light from the background pixels, has to change the ‘rate’ at which the nerve impulses arrive at the visual cortex or we would not ‘notice any color change’.

It is only change in impulse frequency that ever changes. The impulses are all the same size.

So for each person there has to be a mathematical relationship between the red/green balance and the rate of data transfer from eye to ‘brain’/visual cortex.  There has to be a particular ratio/balance which sends the highest amount of data.

Is this what affects crowding and visual attention span and ultimately the development of automaticity reading fluency/performance and attention?