It has been
said that Nystagmus is one of the most common forms of visual disability
experienced by Schoolchildren. The same would then of course be true of all age
groups, since it does not ‘ go away’.
What I have
done in this blog is to try to explain and demonstrate how a ‘nystagmus’
actually affects the biology of reading. I have been privileged in my work with
undergraduates in the UK; working with and assisting many adults who despite
their nystagmus have made it into Higher education. With each one I have had
the opportunity to work with them for several hours in my work with OmniRead
and before that TintaVision.
I have been
able to work with them to reduce the
barriers to studying which their disability creates.
All this work
is done objectively, using a binocular eyetracker which allows me to compare
the actual dynamics of their eye movements as they read to those students with
no reading difficulties.
Together we
then calculate the conditions which will maximise their reading performance, by
careful adjustment of the
parameters which control the visual
system’s ability to collect and transmit visual data as they read. All the optimisation work is done using the
controlled reading environment of a computer screen using the protocols and software developed by OmniRead and before by TintaVision.
Each person
needs their own specific conditions to read the most effectively. When they use these conditions then the way
their eyes collect visual data mimics much more closely the way the most fluent
readers do so.
Enjoy this
posting . Please post comments or ask any questions that will help you further
. There are other postings in the blog which put this work into context.
The graph
below shows the eye movements of a Higher education student in the UK reading
from a computer screen. This is for a period of 14 seconds.
The data was
collected using an infra red eye tracker measuring horizontal eye movement at
300Hz.

Summary
A student
with a nystagmus ….
1. Collects and
transmits a very small amount of visual data per second compared with a fluent
reader.
2. Almost
certainly need to use more computational resources making greater demands on
their central executive for visual processing than a fluent reader.
3. Collects
reducing amounts of visual data per second as the reading time extends.There is
a serious stamina problem.
4. Using
optimised reading conditions increases the amount of visual data collected and
transmitted per second and can improve the quality of the data, thereby
probably reducing the demand for resources from the central executive with the
major benefits ensuing from this.
5. A person with
a nystagmus has difficulty maintaining a
fixation.
A fixation is
when the eye stops to collect the visual data allowing edge detection. The
computation of the data into lines /edges can be converted into visual images matched
against visual images retained in long term memory and enable reading. This is not really ‘ like photography’ as
taught in schools but more like the way
the digital data from a roadside camera
can be used to identify a car number plate. Or the way data is used in object
recognition in airport baggage security systems.
The best way
of seeing what is going on is to compare
the eye movement of a person with a nystagmus with the eye movement of a fluent
reader using a binocular eyetracker.


The graph
above shows the eye movements of a typical fluent reader. If we look at the
graph as sets of stairs, the flat parts of the steps are when the eyes effectively
stop moving for a while ,the fixations,
to collect visual data to do the actual ‘reading’. The vertical lines are when
the eye moves extremely quickly to position the eyes to take the next picture. These fast movements are called saccades.
The longer
vertical lines are the saccades back to the beginning of the next line of text.
There are 9
to 10 fixations during this 2 seconds. I
have marked the fixations in green.
During this 2
seconds of reading, the system is not collecting and transmitting visual data
for around 10 milliseconds per fixation, during the rapid movements.
That is for around 100 milliseconds 5% of the time.
This pattern
of eye movement is really a modified
‘nystagmus’.
The nystagmus eye movement
pattern can be considered as a ‘primitive
eye visual search mechanism’
from before a mechanism developed to allow more extended time to collect and
analyse visual data in a more detailed way.
This is partly possible by the development of the types of muscle fibres
found in the muscles which control the eye movement. I need to write a posting
on that !
Let’s now
look again at what happens when a person, with a nystagmus is reading. Look at the
graphs below.

What you can
see is the eyes moving from left to
right ( the wobbly lines moving gradually up the graph) and after 10
seconds a sudden move back to the left of the page.
The left eye appears to be continually ‘wobbling’. The right
eye sometimes wobbles, sometimes it does
not. After 11 seconds both eyes start to
wobble with a much greater amplitude.
During the 10th
second the left eye looks like it is reading moving along the line while the
right eye wobbles. There are 5 wobbles
during this 10th second. What
is important is that the reading pattern by the system does ‘change’ over time;
sometimes the ‘wobble’ is more obvious, sometimes not.

The duration
of the ‘slow stages ( data collection and transmission times) is not consistent.
Sometimes the left eye and sometimes the right eye appears to be collecting /sending
the most data.
The graph
below shows the eye movements after 3 seconds of reading. During these two
seconds the right eye ‘wobbles’ 7 times. The left eye appears to wobble about 5
times while the right eye appears to go through an extended fixation.

If we compare
this to what happens after 11 seconds when the system goes into a more obvious ‘wobble’/nystagmus;
in this 2 seconds there are 6 ‘wobbles’.

Most people when
reading take three or four pictures per second, so that is effectively the same
as the number of ‘wobbles our student
was experiencing.
If we look at
the amount of time being spent actually collecting and sending visual data to
the ‘brain’, you can see quite clearly that the left and right eye are able to
send different amounts of data and that the
two eyes although acting ‘sort of together’ are to some extent out of
step, or phase, with each other.
In the first
few seconds of reading by the student with the nystagmus….
the ‘green’ (data transmission)
time is far less than the 95% of time
for the fluent reader.
1. The fast
movements are slower than for the fluent reader.
2. The ‘slow’ stages are very unstable and
actually hardly stop at all, so that the ‘computing of steady images will be more demanding on
the central executive leaving fewer resources to make sense of the ideas in the text.
(Please note
though that for even for a fluent reader, when you look really carefully at the
eyes during fixations, the eyes do not actually stop. There have to be small
movements continuously or they stop collecting and sending data; but these are
very small movements.)
The graph of
the reading after 11 seconds, shows that the ‘slow movement (visual data
collection and transmission time) is becoming more restricted. Increasing the demand on the visual processing
system.
Now consider what happens in terms of vision
during the nystagmus eye movements.
There is no
data transmission from retina to ‘the brain’ while the eyes are travelling
rapidly,during the saccades. The
transmission only takes place during the moments when the eye is ‘stationary’(
the fixations) OR during the slow phases of the nystagmus eye movement, as the
eye changes direction.
In the graphs
for the student with nystagmus above the slowest phases the eye effectively
stops. Often it seems to ‘stall’ as if it is being ‘held back’ as if there is a
feedback inhibiting the ‘fast movement’ or saccade.
There is a
mechanism for ‘fixing’ but the feedback seems very weak and variable.
The following graphs were made
using data when the student was reading using optimised conditions.
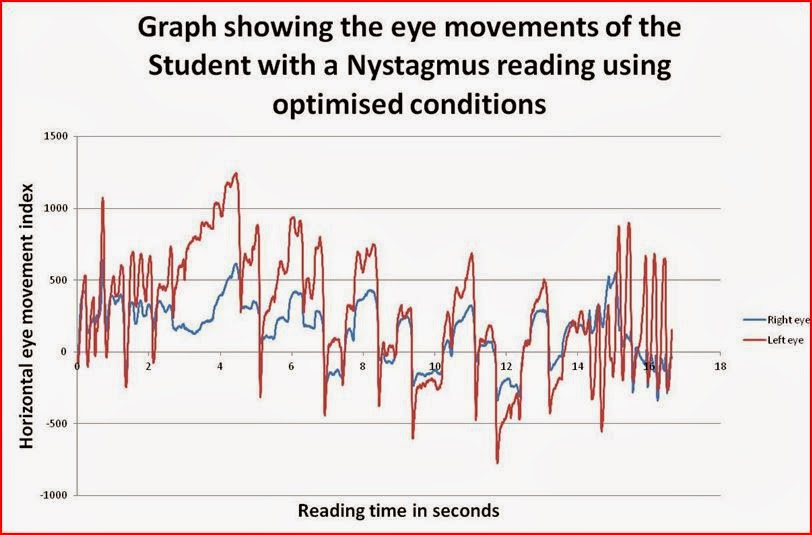

The first
graph shows all the data collected by the binocular eyetracker with a period of
about 2 seconds before they saw the text. This shows the ‘typical eye movement
of a person with a nystagmus. There is then a period of around 12 seconds of
reading ,when the eye movements are much more organised, starting to look much more
like those of a fluent reader. This
reading period is followed by 3 seconds when the text has been removed from the
computer screen. The eye movements revert to the typical nystagmus ‘style’.
Using the
optimised conditions the visual data collection and transmission time ( green sections) is a far
greater proportion of the time. There
are now quite clear ( although still unstable) fixations. The fast movement phases are ‘faster’ and a
much smaller proportion of the reading time.
The student
starts to enjoy reading.
…
…..
No comments:
Post a Comment