Thursday 28 March 2013

Cogan’s Occulomotor Apraxia, dyspraxia, dyslexia, binocular instability... a case study


Cogan’s Occulomotor Apraxia, dyspraxia, dyslexia, binocular instability... a case study

Abstract
A study of visual intervention, to improve reading performance (phonological  processing) of a young man originally identified having congenital occulomotor apraxia (COA).COA interferes with visual search mechanisms by restricting the formation of saccadic eye movement, He was then identified as being Dyspraxic and later as he entered Higher education he was assessed for dyslexia and was identified as dyslexic.

This intervention took about 1 hour and application of the findings appears to give rise to a measurable increase in phonological processing speed of 21%...

The testing included recording and measurement of his eye movements, which are subliminal at different stages.

The control of saccades and fixations are managed by the cerebellum in response to visual processing data and in turn feedback to the edge detection data which is a product of the controlled saccades and fixations. This can be considered in the context of the work on the relationship between cerebellum functioning and dyslexia as centred in the UK at the University of Sheffield led by Nicholson and Fawcett. It can also be considered in the context of the ideas on magnocellular deficit and dyslexia developed in UK by John Stein et al at Oxford with its ideas on binocular instability which is considered to be dependent on cerebellar function.


This week I had the privilege of working with a young man (‘A’ )who was diagnosed in his first year of life as having ‘Cogan’s occulomotor apraxia’ ( Google it for more information).

This is a condition which is congenital and is linked with the initiation of saccades; the rapid eye movements which redirect the eyes to new objects of attention. In the graphs on eye movement in previous blogs these are the vertical lines on the graph as the eyes move from one word to the next...Or the end of one line to the beginning of the next line.

It is not that the eyes cannot do these movements; it is that there appears to be a fault in the mechanism which means that they sometimes do and sometimes do not occur.

When using a binocular eyetracker with many dyslexic adults, it is quite common for one of the eyes not to saccade when reading in a default computer screen environment.

When A was young he was diagnosed as being Dyspraxic, which is defined below.

Developmental dyspraxia is an impairment or immaturity of the organisation of movement. It is an immaturity in the way that the brain processes information, which results in messages not being properly or fully transmitted. The term dyspraxia comes from the word praxis, which means 'doing, acting'. Dyspraxia affects the planning of what to do and how to do it. It is associated with problems of perception, language and thought.

A typically broad definition, but it was the origin, in a way, of a great deal of research into Dyslexia at Sheffield University.  Rod Nicholson and Angela Fawcett’s work showed a statistical relationship between muscle tone management and the reading difficulties associated with Dyslexia. This led to intervention work concerned with attempts to train the Cerebellum, which is the brain’s centre for muscle tone management and coordination.  At one extreme it led to the throwing bean bags in the air, wobble boards, to try and remediate ‘the problem’. It also led to the overlap in the protocols for the identification of people with dyslexia and dyspraxia and much confusion.

Children with COA need a proactive interaction to mitigate the effects, such as speech therapy and hand eye coordination excercises. There are strategies which the person develops to initiate saccades, such as head thrust. Brief sideways jerking of the head) As such with appropriate support the effects of the apraxia become less and less disabling as the person goes through their second and third decade.

In the case of A, a remaining issue is his dyslexic characteristic. My task was to investigate what was really happening visually and to find out if his reading performance (phonological processing output!) could be improved by adjusting the visual processing input.

Stage 1
Is there any history of ophthalmic problems?
Visits to opticians suggest that there are no focussing problems that can be dealt with by ophthalmic intervention. .. Vision is normal.  A relatively quick check by myself confirmed this to be the case.

His job is that of a graphic artist. Precise vision is needed for this.  An example of his work is given below. (Google Jakgibberish for more examples)


Stage 2.
Find out about his eye movement management in non reading activities.

The graph below shows A’s eye movements during normal visual activity; looking around the room we were sitting in...


Normally you would expect the two eye traces to be matched with distinct, synchronised saccades and fixations.  The left eye (the red line) does show a few saccades, I can pick out six by the right eye (blue line). There are no clear fixations by the right eye and the right eye goes into a nystagmus occasionally which interrupts the work of the left eye, pulling it sideways.  

Head movements would show up as a sloping graph, but if both eyes were ‘linked together normally the angle of the slope would be the same for both eyes. This is not happening here.

Stage 
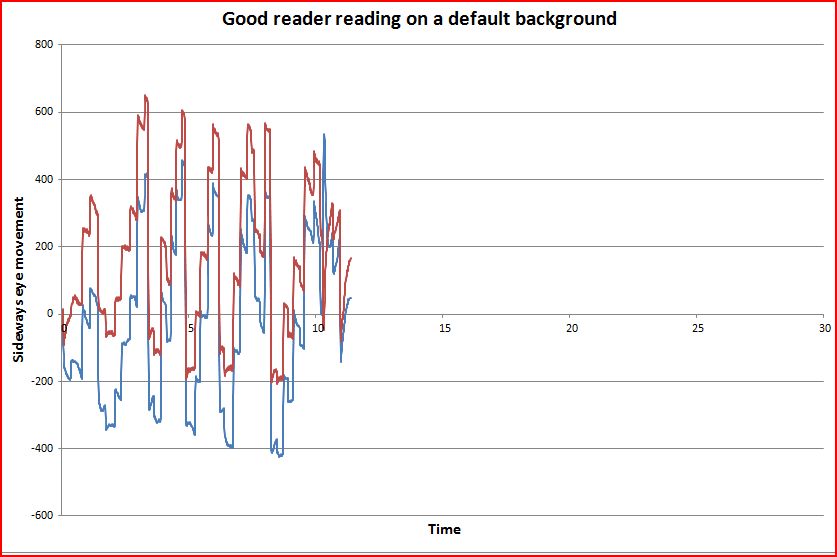
3... Finding out what happens in default reading conditions, the default is a default (12) font with a white background.


A’s left eye, is moving in a rational way typical of many readers with clear saccades and fixations, but with many regressions . His right eye meanwhile, has been turned in towards his nose (to the left) and is no longer looking towards the text. For his right eye there are no clear saccades except at the ends of lines.

The rest of the time, the movements of his ‘reading left eye’ are not influencing/ controlling his right eye. Although in the third and fourth line, the gradual upward movement during each line suggests that there is some linkage.  You can see three bursts of nystagmus type activity as well.

We can conclude here that there is no initiation of saccades, no ‘visual search’, no attention originating, fixations associated with the right eye, which is a functioning eye.  A decision has been made by his visual system to suppress it! In biological terms this implies that he is getting better visual data, by using visual data from only one eye; his left onewhatever the visual activity.

Stage 4. Get a measurement of reading performance.

Using the same Oral reading fluency test that has been used with over 12,000 adults, A read off a computer screen with a font 12 and ‘white background’

Default Oral reading fluency…….105 wpm
The reading style was stocatal; individual words were being read in syllables; limited blending.
The mean reading speed for this text by dyslexic undergraduates is 138 wpm. For non dyslexic undergraduates it is 184 wpm.  I can quote Standard deviations but not here.

At the conclusion we will measure Oral reading fluency (a measure of phonological processing) with an equivalent text, using whatever optimal settings we identify.

Stage 5..Find out if font size influences reading performance.

 This was undertaken binocularly. The data was unclear. There was a hint that a larger font than default 12 might be useful and it was decided to use
font 16 point for the next stage.

For many dyslexic people there is a clear mathematical relationship between font size and reading performance. See the other posts on this blog.

At this point it became clear that testing A binocularly was going to be too stressful. The screen optimisation continued monocularly using only his ‘good’ left eye. His right eye was covered. This meant that it would still move dependent only on visual data collected by his left eye,

Stage 6... Find out if screen brightness influenced reading performance.


There was a linear relationship between screen brightness and reading performance. Reduction of overall brightness gives rise to a slower reading output. 

For the majority of dyslexic undergraduates the screen brightness needs to be reduced.


Stage 5. Finding out if reading performance was affected by red or green pixel brightness.


A did respond to changing the green pixel brightness but it was a far smaller effect.


Stage 6...Response of reading performance to Blue pixel brightness

There was no response to changing the blue pixel brightness... The magnocellular difference model of developmental dyslexia implies that a response would be expected. But there was none.
Actually very few dyslexic undergraduate respond significantly to changes in blue pixel brightness.


Stage 7...Checking Oral reading performance with the identified screen settings.


This was using a font 16 and the following background screen settings.


Oral reading performance…..127 wpm.

In addition the reading ‘style’ was more fluent, whole word enunciation now being with a clearly prosodic component.

This is a   21% measurable increase in performance. 

I have not yet found a way to quantify Prosodic performance, but I am following the development of The PRAAT methodology in this area. (Please google this if you are interested.)


Stage 8... Finding out how A’s eyes were behaving in the new conditions.


This was not quite what I expected.  But in retrospect his right eye had been covered virtually continuously for about 30 minutes! By the end of reading the text both eyes were starting to work together, this can be seen especially in the third and fourth line.   But there are still the quite distinctive nystagmus zones when the trigger mechanism is breaking down.
A series of readings were then done reading monocularly. From previous experience A was asked to read for a while using only his  right eye and the optimal conditions. This is an attempt to get the ‘brain’used to a new capability.

Left eye covered, using only his right (Poor?) eye.


The interesting thing here is that with the optimal background and with no data coming into his left eye, the data being collected by the right eye was able to enable the control of the movement of his left eye .
Right eye covered, using only his left eye.

With his right eye covered, the data being collected by the left eye, His right eye moved in time with the controlling left eye, although it did not show the crispest saccades and fixations But the fixation disparity (distance between the attention points) of the two eyes was more erratic than when it was the right controlling the left.


Finally an eyetrace was undertaken binocularly with a small font (10 point) such that more data was landing in the foveal area of the retina...


The two eyes are now yoked together, but the font probably too small for the highest quality of fixation.
The graph below shows detail over a 2 second period, which is typical of the entire graph above. Both eyes show clear yoked saccades and fixations, but the right eye shows slight fixation instability. But this is typical of many good readers.


The slight right eye fixation instability most likely would be solved with a slightly larger font.

We will now wait for a while for A to make use of his settings in reading/inputting computer activity during which time it is likely (I think) that there will be a change in the innervations (how many motor end plates are used in the muscle fibres) and control of the core muscle fibres In the occulomotor muscles of his right eye, which are responsible for managing the actual fixations. (This is a new experience for his eye muscles!)
If you are interested in histology and muscle fibre design I commend you to look at them literature ion this area.  Occulomotor muscles are I believe their own class. They are not cardiac, smooth or skeletal in design. They have a fascinating histology and physiology of their own; befitting their role in precise strategic visual data collection.

Wait for the next thrilling instalment in the control of phonological output by the visual processing system!

I look forward to comments and questions.

Friday 22 March 2013

A direct comparison of the eye movements of a good and poor reader. Both dyslexia support professionals in the UK


Today we took two colleagues and put them on the eye tracker using the same text. 
One was a ‘self-confessed’ good reader. The other was a self-confessed dyslexic reader. The two eye traces are below.

The fixations for both took about the same time, around 280 milliseconds.

The dyslexic colleague, was processing far fewer characters per fixation than the good reader and the right eye was being suppressed, although the optician had said that there was no optical problem with it.


I did then optimise the screen settings for him.  The last graph shows the poor reader reading for the same time period on equivalent text with the same font size.
The reading speed of the dyslexic/poor reader increased from 180 wpm to 418 words per minute.
The non dyslexic colleague was reading at.  474 words per minute on a default setting.

The minimal saccades for the poor reader's eye movements on default would likely give rise to muscle tone build up in the oculo motor muscles reducing eye motility.and reddening of the eyes,


Wednesday 20 March 2013

Phonics training for English-speaking poor readers (Review)


I thought that I would bring the attention of my blog readers to the Cochrane Review at the url below where the entire review can be read.
It was referred to in a recent tweet from Dorothy Bishop.
We have an education industry which has been sort of hijacked by a ‘belief’ in phonics which it is implied originates from a robust research based model. 
…………………………………………………………………………………

Phonics training for English-speaking poor readers (Review)

Implications for practice
The results of this review suggest that phonics training had a
large effect on nonword reading accuracy, a moderate effect on
word reading accuracy, word reading fluency, spelling, letter-sound
knowledge, and phonological output. Preliminary evidence from
just three studies suggests that phonics training may only have a
small effect on reading comprehension. A small-to-moderate negative effect was found for nonword reading fluency.

Only three of the results were statistically significant (for nonword reading accuracy, word reading accuracy, and letter-sound knowledge).
Whether results for other outcomes were statistically significant
or not may have depended on the amount of data from which
they were calculated. Overall, the findings suggest that teachers
and reading professionals should test poor word readers for a wide
range of reading skills to determine if they have the type of poor
reading that responds to phonics.


Implications for research
The outcomes of this review have at least eight implications for
research.

 First, there is a widely held belief that phonics training
is the best way to treat poor reading.

Given this belief, we were surprised to find that of 6632 records, we found only 11 studies that examined the effect of a relatively pure phonics training programme in poor readers. While the outcomes of these studies generally support the belief in phonics, many more randomised controlled trials (RCTs) are needed before we can be confident about the strength and extent of the effects of phonics training perse in English-speaking poor word readers.

Second, more studies are needed to look at the effects of combining
phonics training with other reading skills. At this early stage of
research, it would be best to look at the effects of training phonics
with just one other reading skill. As our understanding of these
simple effects increases, we can start to look at the effects of training
phonics with two other reading skills, and so on.

Third, as mentioned above, this review revealed that phonics training has different effects on different types of reading skills. Most
of the studies in this review included measures of word reading
accuracy.

Only one study tested nonword reading fluency and
no study tested letter identification. Further, only three studies
measured letter-sound knowledge, which is surprising given that
phonics training focuses on letter-sound knowledge. Future RCTs
of phonics training would do well to include a more comprehensive range of reading outcomes to understand the true effects of
phonics training on poor word readers.

Fourth, more research is needed to understand the effect that nonreading moderator variables –
.. such as training type, training intensity, training duration, training group size, training administrator…
- have on the effectiveness of phonics training on poor reading.
In this review, we attempted to address these issues via the subgroup analyses for each outcome. However, only two outcomes
had enough studies to conduct these subgroup analyses. Thus,
more research is needed on the effects of moderator variable on
the efficacy of phonics training

Fifth, the small-to-moderate effect of phonics on phonological
output, which we indexed with phoneme awareness outcome measures, was interesting because it addressed a controversial issue
regarding the strong relationship between reading and phoneme
awareness. There is a widespread assumption by many researchers
and clinicians that poor readers have poor phoneme awareness
because phoneme awareness causes poor reading. However, there
is good evidence that reading ability affects phoneme awareness
(Bishop 2004; Castles 2004).
The current review suggests that the effect of reading ability on phoneme awareness is small-to-moderate in size.

Sixth, the ’Risk of bias’ analyses in this review revealed that studies of phonics training on poor readers need to improve the reporting of their methods. While most studies in this review stated that they used randomised allocation of participants to groups, few actually described how they generated the allocation sequence or concealment in their publications, and so we had to ask for this information personally.

While double-blinding is difficult to guarantee in cognitive treatment trials, few studies explained how they at least attempted to instigate double-blinding. Thus, future RCTs of phonics programmes need to explain the methods of their RCTs in more detail. The CONSORT (Consolidated Standards of Reporting Trials) 2010 guidelines may prove useful in this respect.


Tuesday 19 March 2013

Theory and practice. Applying visual processing ideas in a primary School


Theory and practice. Applying visual processing ideas in a primary School

Today, my colleague and I begin a short longitudinal study with a UK Primary school.

Background
All of the pupils at this school will have followed assiduously the UK government Phonics programme for the last five years.  

This study will consider what might happen if visual processing is added to the provision.

The use of binocular eyetracking technology will allow the consideration of visual span/perceptual span as a contributor to reading fluency and the quantification of benefit from optometric /orthoptic intervention and visual parameter intervention (font size and text background).

The outcomes will be considered in terms of the role of visual crowding in reading performance.

Other posts in this blog look at these issues in adults.

Method
Screen all Year 6 with CRST test ( a comparative rate of reading test) to indicate eye tracking and visual crowding problems, and a computerized Oral Fluency Reading (ORF) test, age suited, to attain words per minute reading speed. Combining the results we will attain a percentile rank of each child in class, which can be compared to school assessed reading levels.

Both these tests can be undertaken in school by a Learning Assistant.  Each test takes approx. 1 minute to perform
Select the bottom 20th percentile, plus any other students who have not been captured in this group but who the school feel would benefit from further investigation. (A maximum of 9 students for logistical purposes)

Treatment

For the bottom 20% group in rank order and those identified as outlined above.
We will run clinic with parents attending if poss. to perform following:
Stage 1. Optometric assessment
·        Assess accommodation ability with RAF rule, dynamic retinoscopy, near duochrome, and +1.00 binocular add test
·        Assess convergence , near muscle balance and AC ratio using RAF rule and Maddox wing
·        Check for fixation disparity with any reading add found using near mallet unit. Determine prism as indicated, then check stereopsis and suppression.
·        Prescribe and dispense any reading specific glasses initially clear.

The above testing will take approx. 30 mins per student

Stage 2 Optometric provision

In the test group any spectacles required will be provided and worn for the following tests.
·        Re-measure CRST and ORF with specs if required
·        Initial eye tracking plot on default font/size and white screen.

Stage 3 Computer screen optimisation

·        Optimize font size
·        Optimize colour and luminance
·        Repeat eye tracking with best colour and font.

Stage 4 provision of provision tinted glasses

·        Return any prescription spectacles to lab for precision tinting or dispense plano spectacles with the precision tint found.
·        Supply tinted specs to child,  retest whole class CRST and ORF in school by Learning Assistant
·        Recalculate and compare percentile class ranking to the original
·        A second pair of spectacles with 50% reduced power and incorrect tint will be dispensed to all selected students, and CRST and ORF results compared. The Learning Assistant will not be told which the correct specs were; this would act as a double blind placebo test.

Stage 5 Longitudinal study

Return after 1 month for
  1. teacher assessment of any reading change,
  2. Eye tracking plot all pupils in group.
  3. CRST   all pupils
  4.  ORF all pupils

After 6 months

Follow up 6 month an optometric assessment of all in test group.


Thursday 14 March 2013

A group of 3 adults. Dyslexic or not? Change in reading performance .


A group of 3 adults. Dyslexic or not? Change in reading performance .

Yesterday I wrote that I would be working with adults at an FE college, who had difficulties with reading.  I have been interested for a long time in the difference between a person who is identified as Dyslexic and a person who may be dyslexic  but has struggled with text just as much as a person identified as dyslexic but been identified and then in the UK with a different level of support/intervention.

In Further education colleges, in the UK, there are now many people undertaking courses to try and improve their employment opportunities. Many of these are people who have had ‘doing the courses’ as a condition of their continuing to receive welfare benefits.

No one has ever actually recorded the literacy levels of this group of people, but improving literacy and numeracy this is a fundamental component of many of the courses.

The people I am working with attend a very forward thinking college in the UK. As a component of the course I am advising on analysing the participants in terms of trying to identify if there are any  limiting factors/barriers  to their reading performance which can be lowered or removed easily. This could lead to a step change in their reading performance.
My contribution  is to identify if there are any correctible visual processing barriers  which can be identified.  This connects with other posts concerning whether visual processing is limiting /controlling phonological processing for any of them and whether the limiting effect can be reduced.
Identification of dyslexia and  teaching strategies associated with that is left to my colleagues at the college.  In an  FE college, in the UK, the provision of funding support from an Additional Learning Support (ALS) fund is not dependent on a psychological  analysis/labelling process but on the professional assessment of each individual’s need.

What did I learn?
The three of them were quite different.  But before we start I should state that I could not get the binocular eyetracker to work which substantially restricted my analysis.  I think a connecting cable  needs replacing!

...............................................................................
Student 1  (B)
Summary
Default Oral reading fluency….  81 wpm
Optimal font size reading fluency…104 wpm
% improvement/benefit……..  28%.
No response to changing background settings
Stamina /fatigue problems during the meeting probably associated with oculo-motor/ muscular management problems.

B had had problems at school, a slow reader and writer he could not keep up when the teacher was writing on the board.  Or if he had to copy it down, it was always wiped off before he could complete it.

 B was often told off for copying from the person sitting next to him. When trying to read by himself he always got easily distracted and needed to keep his finger on the page so that he knew where he was when he had been distracted.

 He has no problems concentrating on a computer game or with diagrams.  The concentration problems only happen when he is reading.

In school, when sharing a book, he regularly had to pretend that he had got to the bottom of the page when the person sharing with  him asked. 

‘ Have you finished yet? ‘
‘Can I turn the page over?’
He simply could not keep up.

When copying words off the board he could never keep up. The teacher would rub off/wipe the board before he could copy it down.

His writing was slow and very hard for him to read let alone his teachers
Reading would give him headaches at the front of his head particularly above his right eye.

His distractibility and slow speed eventually give rise to behaviour of school avoidance, marginalisation and eventually to persistent truancy.

He had come back into FE college to do a functional  Maths and English course.
.
So the questions to ask are

Is B dyslexic?
How do we help B?

His Tutor at the FE college he attends now had tried all basic interventions and did not believe he would be diagnosed as dyslexic, I was told later that he may be identified as Dyspraxic..  My job was to find out if anything had been missed.

So what was the evidence?

B  had been told by his optician that his vision is perfect. 20/20. He was tested at distance.

With close work there appears to be a convergence problem.  He needs to keep moving the book/computer away from his eyes to maintain ‘focus’.

  This does not appear to be true when he is gaming with his X-box.
 
Reading is quite a rigid, iterative process compared with graphical activity, it appears to put more stress on the muscles of visual system. Possibly because for a slow reader the sideways moving muscles are only contracting very short distances at a time, while the other four muscles on each eye have to keep the eye ‘on the line’ for long time periods. A slow reader will have to keep these at the same muscle tone for quite long periods. It must be similar to the effect on your leg muscles of having to walk slowly with tiny steps on an icy/slippery path. The muscle tone builds up, the joints and the muscles ache.
Fast. Fluent readers have much greater perceptual spans, so each saccade is over a comparatively longer distance and  changes of line , using the other muscles are more frequent.

Reading randomly sequenced short words aloud at a default font size of 12 on a ‘white’ background his RAN score was 81 wpm.( In work in schools, 80 wpm appears to be a cut off below which the children in the UK are normally given special needs support.)

Now this test has been used as a measure of phonological processing speed independent of total reading experience and virtually free of automaticity issues because of the short simple nature of the words, and no syntax component.  If this was just a measure of phonological output independent of visual parameters, it should give the same score as rapid digit naming which statistically appears to be true with adults we have tested before.

Reading meaningful text with short words and of course syntax which gives a clue of what the next word should be before you see it  B’s reading speed increased to 128 wpm.  The difference  here can  be argued as associated with the time /milliseconds, it takes for the visual system to identify a word being dependent on the probability of a particular word fitting into the logic/syntax of the preceding word string/ sentence and the mental constructs/ideas inherent in the body of text/associated graphics being accessed  ‘Close’.

Reading complex meaningful text, the same as we use with dyslexic undergraduates, with many more much longer unfamiliar words and more complex prosodic components his reading speed was 59wpm.  BUT importantly he was able to decode and blend all the words, it just took longer.
Reading this more complex text the words were longer approximately 5 characters per word on average compared with 4 characters per word in the simpler text.

So what the consequence of our meeting?

There was a clear response to changing the font size.  B read a block of randomly sequenced small words, repeatedly until  he had reached a maximum speed ( this is leaning/familiarisation with the task.)  When he had reached a maximum speed the font sizes were changed.  The data showed an increased in reading speed until a font size of 25 was reached after which there was a reduction in speed.

There was no clear relationship between screen background settings and reading performance.

What did happen though was a consistent gradual reduction in reading performance over time which masked any other factor.

It seems likely that there is an unresolved problem with vision at near, a convergence insufficiency which needs dealing with. He is to go to an optician and be tested at near.

We do not know how the optimal glasses will  affect his response to font size but the present need for a large font may be associated with crowding effects arising from the problems with binocularity.

I could have checked this by testing him monocularly but we ran out of time.
This would have also been a way of checking if the fatigue problems were linked with a convergence problem. Retrospective analysis is useful when a ‘rematch can be organised. I will have to do that.

………………………………………………………………………
Student 2  (D)

Summary
 D has never been to an optician
There appears to be an severe Astigmatism in her right eye and both eyes appear to be myopic with presbyopia affecting distance vision.
She has a problem of bilingualism and phoneme production. Until 9 years ago she had not read or spoken English.


RDN.. default….  148
RDN font 31…….   193
Benefit of larger font size……  30%
Ran  aloud default..117
Ran default silent( sub vocalising) …..  152
Ran font 31 ( sub vocalising) ……  193
ORF  default..  59 aloud   zero silent
ORF opt aloud    82   subvocalising  178.
Benefit……..aloud     ….39%
Benefit ..reading/any method……  202%
Optimal background white optimal font size 31

Lessons learnt

Her native language was Urdu. She started to read English in 2004.  Reading aloud is emabarassing for her.
At school she always needed to subvocalise and was told off for reading aloud/mumbling.
The limiting factor appears to be optometric AND font size. We do not know how much of the font size is a consequence of uncorrected optometric component.

She is able to decode and blend at her large font but at small fonts it is not blended as easily. This may be crowding affected by font size and associated spacing. We will not know that until she has the correct glasses.
Her left eye has a myopic fixed focus which will make reading at distance very difficult. Except with her astigmatic right eye.  The large optimal font may be associated with compensation for the uncorrected astigmatism.

If RDN is a measure of phonological processing then changing the font size has enabled faster phonological processing.  There was decoding of the numbers but no phonics in the sense of decoding and blending. So in the phonological processing increased by 30%.

If the oral reading fluency is considered , taking away the psychological worry about correct pronunciation ( sub vocalising)  At the default font she could not read by subvocalising. Aloud this went from 59 wpm to 82 wpm    a 39% increase. But since she could now read subvocally at 178 wpm this meant an effective increase in reading performance from 59 wpm to 178 wpm. An increase of  over 200%  . This may sound extreme but that was the outcome.

D will now go to an optician and get appropriate glasses. We can then check what her optimal font size is making use of optometric correction.
………………………………………………………………………..

Student 3  (F)

Summary

 Default ( font 16) 

ORF…. 67 wpm
RAN….92
RDN…. 113  ( no crowding effects)

Optimal
ORF …. 100
Benefit…….  49%

RDN…. 128.
Benefit…..  13 %

Optimum Settings
Red
Green
Blue
229
250
250
Font
21

If we consider that the RDN involved no crowding effects compared with the ORF  then perhaps 13 % of the gain in Orf was associated with crowding.  The rest of the gain in ORF may have been associated with increased processing speed not linked to crowding.

F was able to read all of the texts offered but slowly. The normal sample text used with dyslexic undergraduates was used.

Student F responded to font size, as can be seen in the graph below. 


He also responded to changes in the background setting. But he only needed a very subtle change from white. To him the difference was immense. We needed to reduce the brightness of the red pixels but only by about 10%. All of the filters available commercially would have removed too much red or green  and blue as well. As such when offered them in a forced choice, or casual process, all of them would have been worse than white.  The outcome of course would have been a false negative.

F has now been diagnosed as dyslexic, it will be interesting to watch what happens to his reading performance as the support clicks in.